Average Goals per Game in NHL History
Exploring the season averages of Goals Per Game throughout NHL history reveals periods of fluctuation, with notable stretches below the overall calculated average of 3.03 goals per game. Focusing on the years 1990 to 2023, there was a significant drop in average goals scored per game from the 1992 to 1999 seasons, marked in red, with a decline of nearly one goal per game (0.99). After the 2003–2004 season, there was a notable rise in scoring during the 2005–2006 season, increasing by 0.51 goals per game. However, the average dipped again post 2005–2006 and continued to drop until after the 2015–2016 season, where it has steadily risen. The 2004–2005 season was canceled due to a labor dispute, leaving no data for that year. Closer examination identifies 1997 to 2004 as the years with the lowest consecutive scoring, with the 2003–2004 season reaching a low of 2.57 goals per game. I recognize this timeframe as the "Dead Puck Era."
Goals Scored per Season in NHL History
Looking at the overall history of league scoring, it is clear that scoring has been steadily rising, particularly during years of expansion, marked in green. While there are some noticeable single-season drops, these correspond to years when a full season was not played. Focusing on the period from 1990 to 2023, most seasons in this range got close or exceeded the average of 6,554 goals per season. However, between the 1993-1994 and 1994-1995 seasons, there was a significant drop of 3,354 goals, caused by a lockout that caused only 48 games to be played instead of the normal 82. From 1994 to 2005, although total goals per season remained above average, each season's total was consistently below 7,000 goals, a threshold exceeded by the 1993-1994 and 2005-2006 seasons.
Shooting Percentage
Shooting percentage is a key statistic in hockey that measures how efficiently a player or team converts shots into goals. It is calculated by dividing the total number of goals scored by the total number of shots taken, then multiplying the result by 100 to express it as a percentage. A higher shooting percentage indicates greater scoring efficiency, meaning a player or team is more successful at converting scoring opportunities into goals. On the other hand, a lower shooting percentage suggests difficulties in finishing plays and turning shots into goals, often reflecting struggles in offensive execution or strong goaltending by opponents. Analyzing the overall shooting percentage in the NHL, starting from the 1959-1960 season when it was first tracked, reveals a significant increase from 1969 to 1981, marked in green. This was followed by a gradual decline from 1986 to 2015, shown in red. However, from 2016 to the current 2024 season, there are indications that shooting percentage is beginning to rise once more. The increase in shooting percentage directly connects to the rise of goals scored per season shown in the last section.
Save Percentage
Save percentage is another key statistic in hockey, measuring how effective a goaltender is at stopping shots. It is calculated by dividing the number of saves made by the total number of shots faced, with the result expressed as a percentage. A higher save percentage indicates better performance, as the goalie is stopping more of the shots taken against them. Save percentage is widely used to evaluate goaltenders' consistency and skill, with a typical benchmark for elite goaltenders being above .910, while a save percentage below .900 can indicate struggles in net. The overall save percetage from when it began being tracked in the 1959-1960 season, a noticable drop in save percentage is seen between the years 1970-1982, marked in red, matches up with the rise in scoring as pointed out in the past two sections. During the Dead Puck Era, save percentage rose from the .800 range to above .900 range, with the 2003-2004 season seeing the highest save percentage of .911. It is interesting to note the dip in save percentage from 1999-2002, but it did stay above the .800 range that was seen before the era began.
Expansion
One major argument for the emergence of the Dead Puck Era is the NHL's rapid expansion during the 1990s and early 2000s. Before 1990, the league maintained 21 teams for a decade. However, starting in the 1991–1992 season, the NHL began adding teams almost annually. It started with one new team in 1991, followed by two more in 1992, and another two in 1993. The league stayed at 26 teams for five seasons before expanding again in 1998. By the time the 2005 lockout ended, the NHL had grown to 30 teams. This period of 14 years saw the addition of nine teams—the largest expansion since the league grew from six to 21 teams in the late 1960s and 1970s. The rapid influx of new teams may have diluted talent, contributing to the defensive, low-scoring style that defined the Dead Puck Era.
Key Changes That Ended the Dead Puck Era
Ice Surface Changes

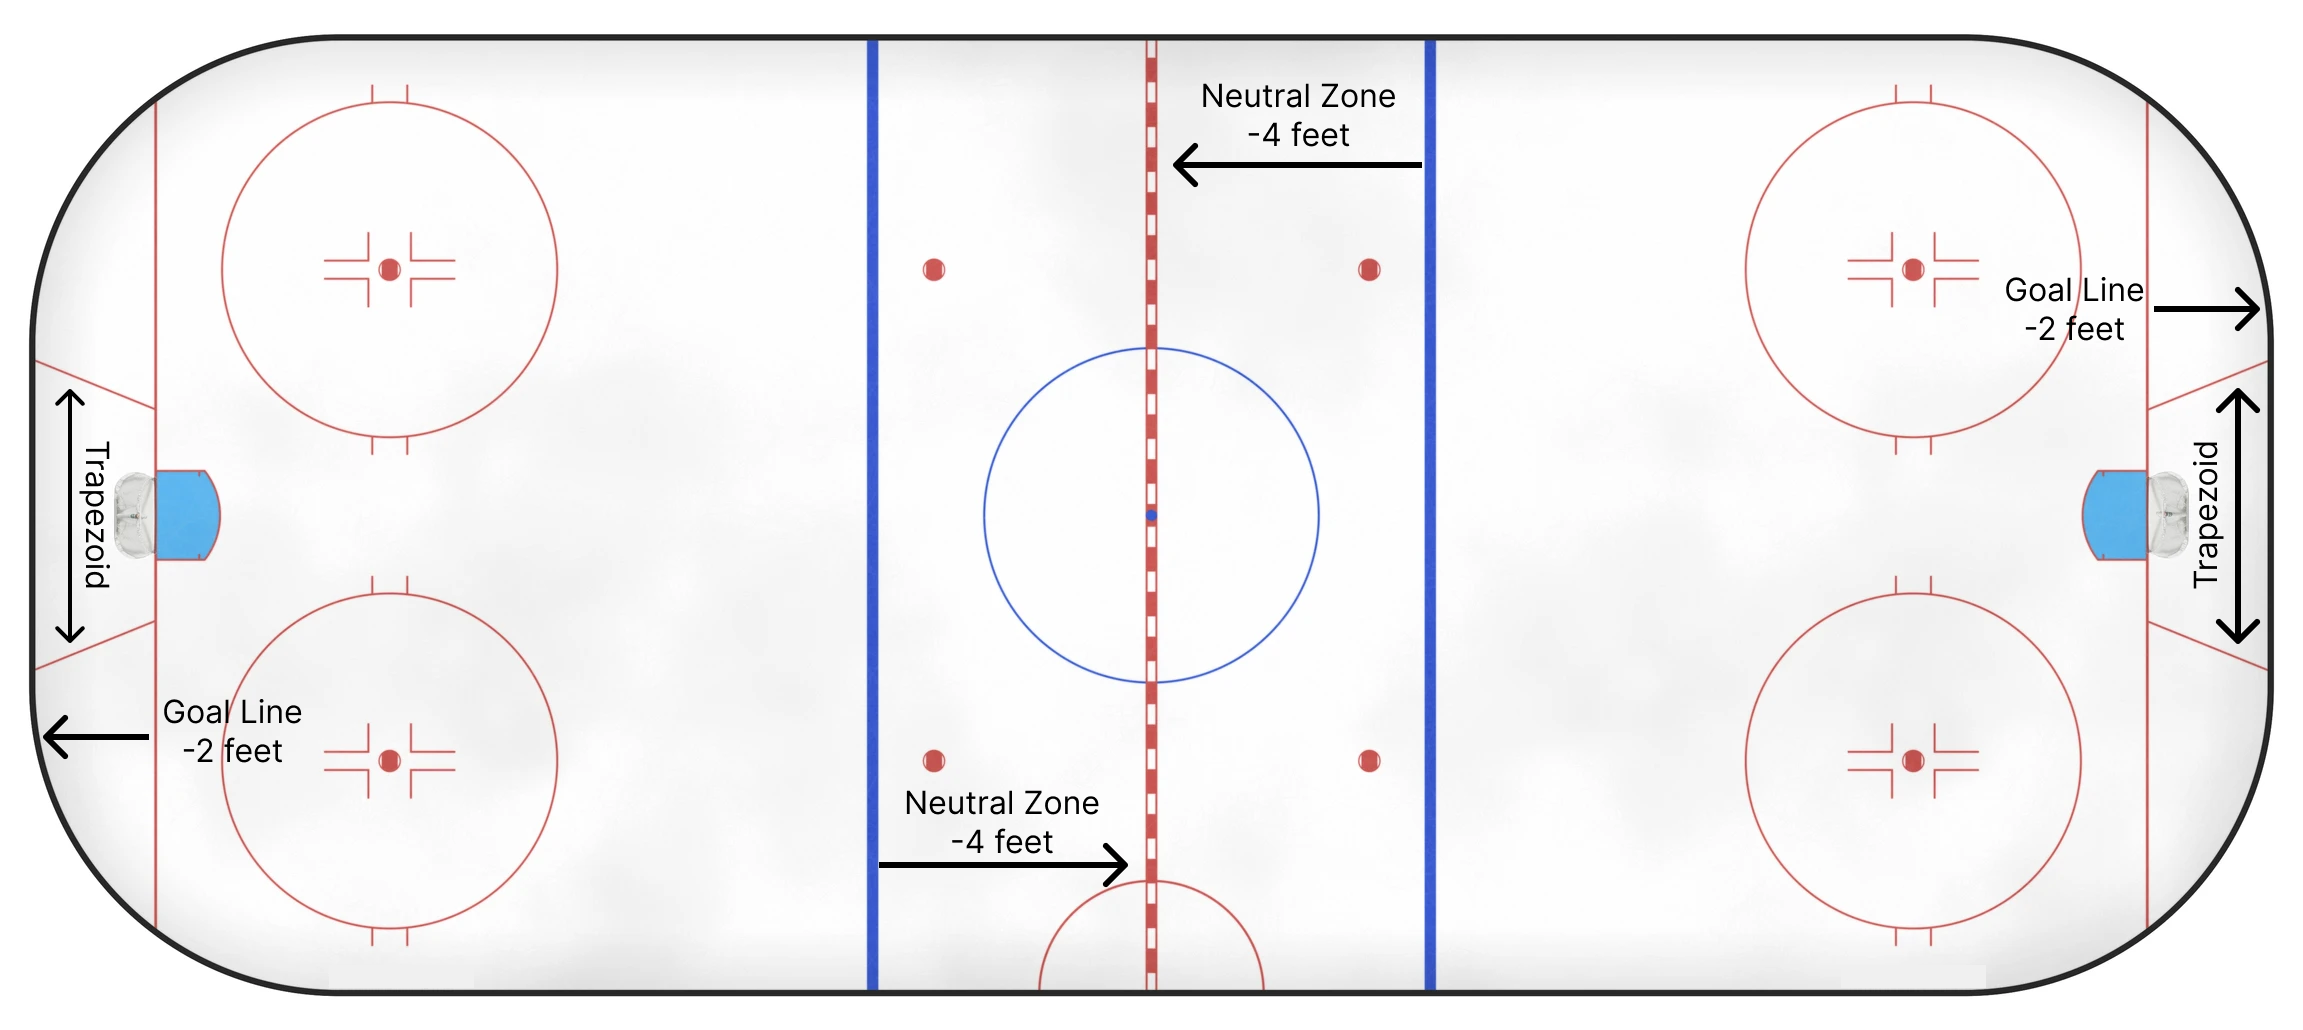
Several significant physical changes were made to the ice surface to increase the speed and flow of the game. The neutral zone, the area between the two blue lines, was reduced in size from 54 feet to 50 feet by moving the blue lines four feet closer to center ice. The goal lines, positioned in line with the net, were shifted two feet closer to the end boards, leaving 11 feet of space between the goal line and the boards. Additionally, a trapezoid-shaped area was introduced behind each net to restrict where goaltenders could handle the puck, limiting them to this designated zone instead of the entire area behind the goal line.
Rule Changes

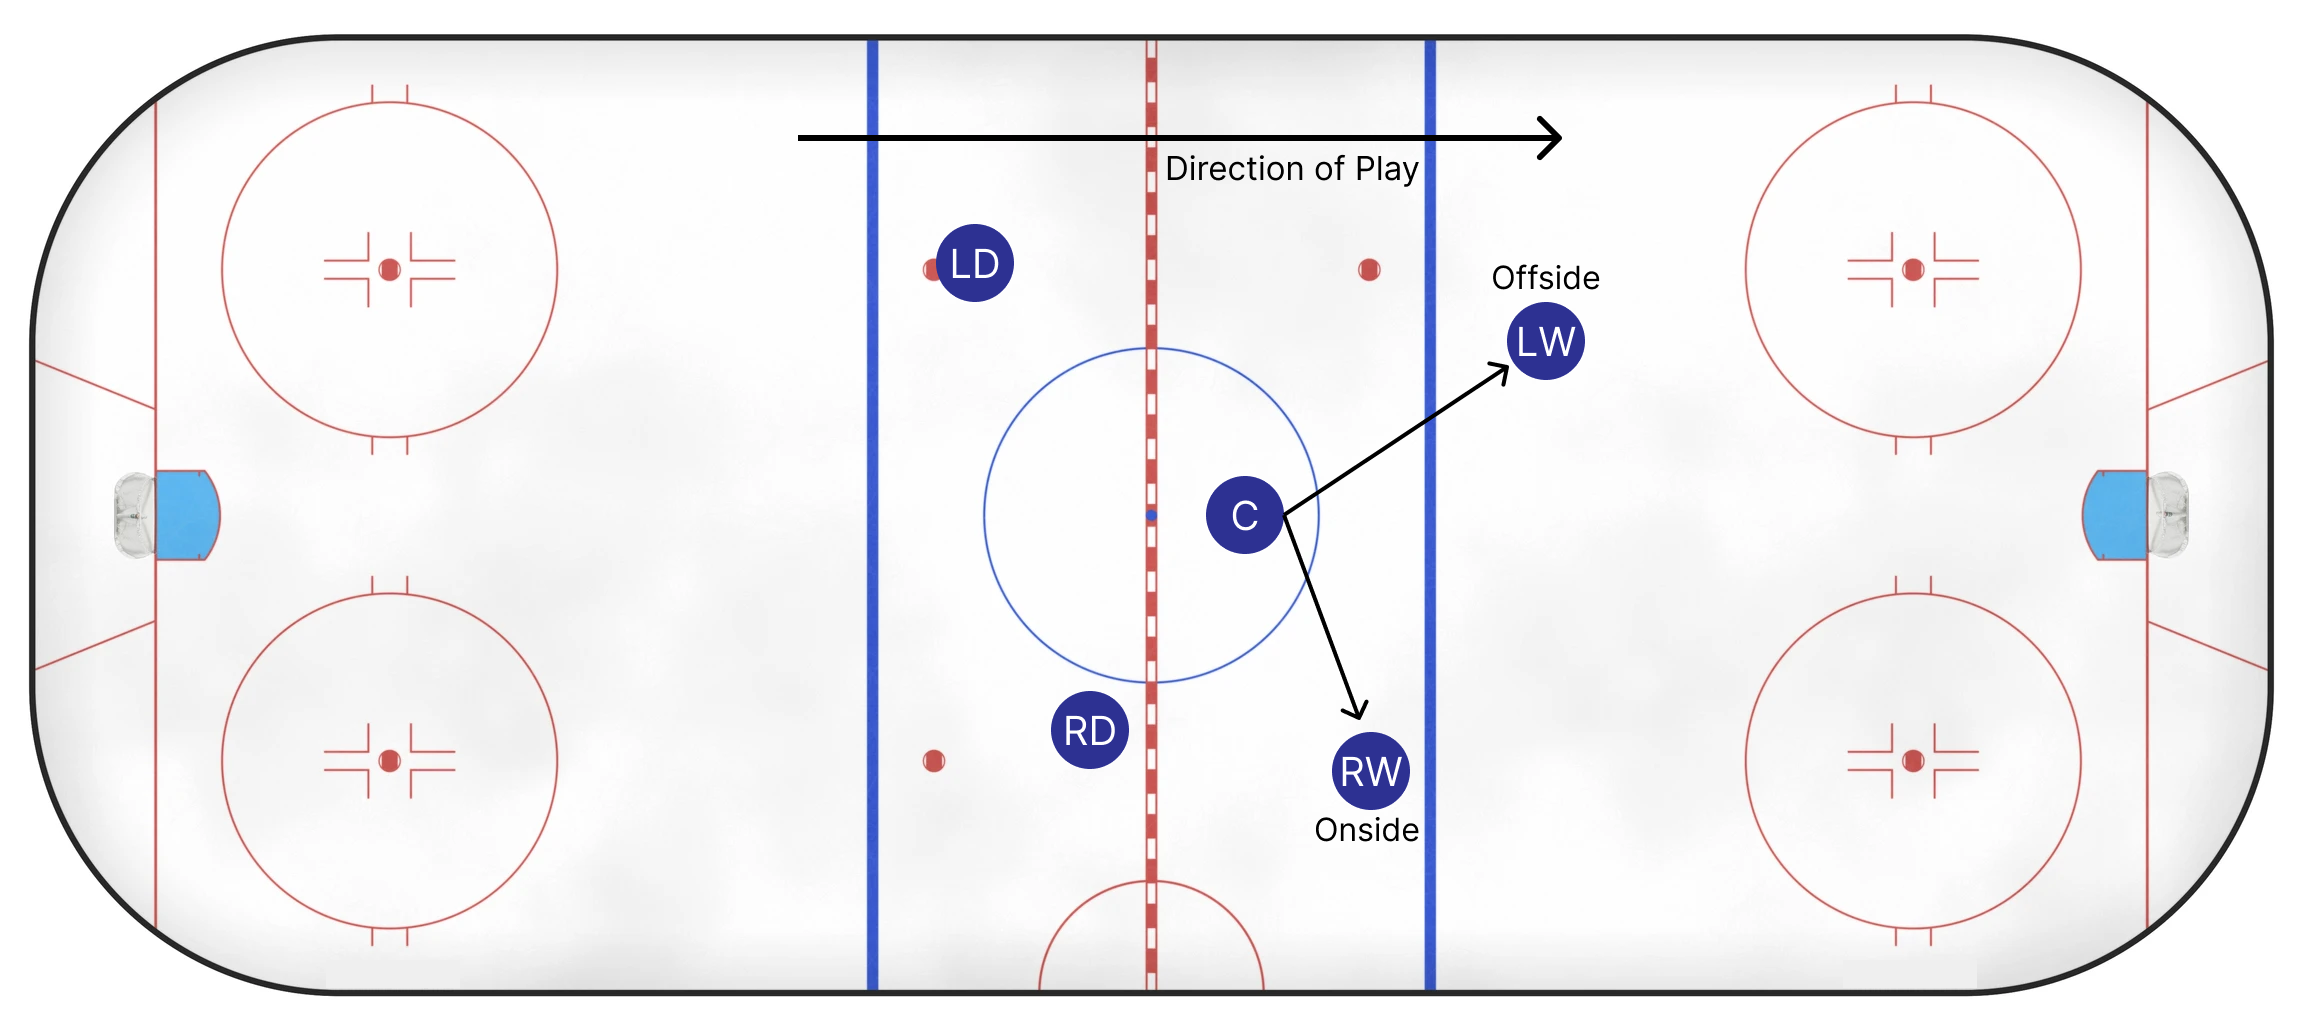
In addition to physical changes to the ice surface, several key rule modifications were introduced to enhance offence and scoring. One of the most impactful changes was the elimination of the two-line pass rule, which had previously prohibited passes that crossed both the center red line and the opposing blue line. By removing this restriction, teams could make quicker, longer passes, speeding up the transition to offense. Another important change was the reinstatement of the "tag-up" offside rule, which allowed players to re-enter the attacking zone without stopping play if they had previously been offside, as long as they tagged up (i.e., re-established themselves onside). Previously, a whistle would blow immediately if a player crossed the blue line ahead of the puck.
Goaltender Equipment

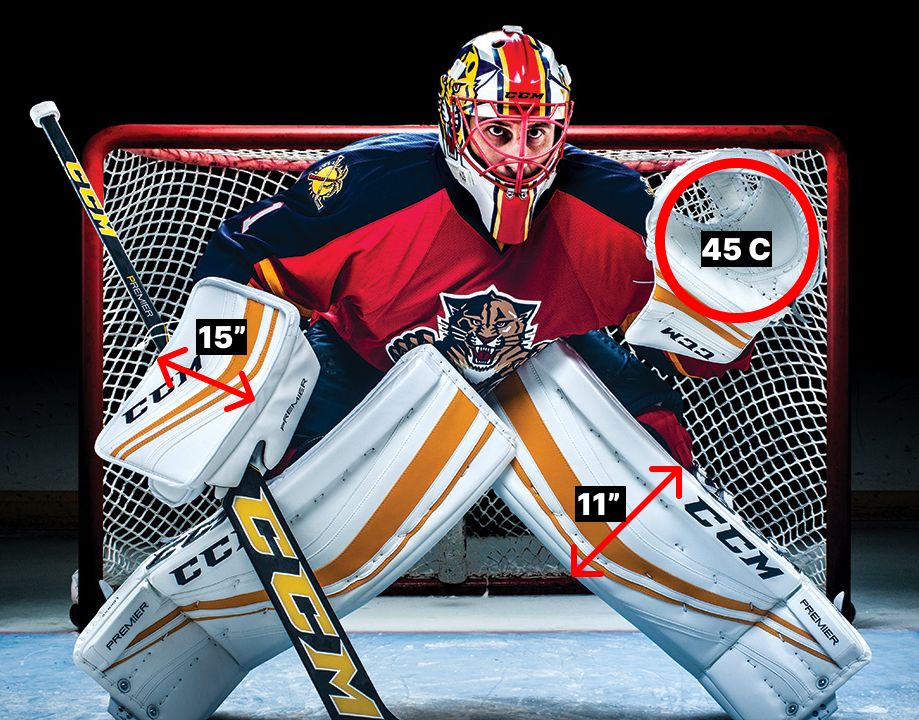
Rules surrounding the goaltender’s equipment were changed following the 2005 NHL lockout, with stricter regulations on the size and fit of gear. Jerseys and pads had to be more form-fitting and proportionate to the goalie’s body, ensuring a more uniform look. Leg pads were limited to a maximum width of 11 inches, while blockers were reduced from 16 inches to 15 inches. The circumference of catching gloves was also decreased, from 48 inches to 45 inches. These changes aimed to make it more difficult for goalies to control the puck, leading to more scoring opportunities. The rule changes also helped reopen the five-hole, the narrow gap between a goaltender’s legs, specifically between the pads and the body, thus creating additional space for shooters to target and score.
Penalties
The final significant change following the 2005 lockout was the crackdown on obstruction penalties, specifically interference, hooking, holding, tripping, and stick fouls. Prior to the rule changes, penalties for these tactics were either rarely called or completely overlooked, slowing the game and reducing scoring opportunities. With stricter enforcement, the goal was to accelerate the pace of the game and encourage more fluid, continuous play. The enforcement of these penalties also introduced the embellishment rule, which penalized players attempting to fake fouls to draw calls. These changes significantly improved the flow of the game, encouraging more open play and helping to restore excitement.
When examining total power play opportunities from 1990 to 2005, several intriguing trends emerge. The crackdown on obstruction penalties led to a significant spike in opportunities, increasing by approximately 4,000 between the 2003-2005 and 2005-2006 seasons. During the Dead Puck Era (brown-coloured dots), power play opportunities consistently remained below 11,000, with only one exception. This suggests that the lack of enforcement of obstruction penalties likely contributed to the characteristics of the Dead Puck Era. After the 2005–2006 season, power play opportunities experienced a sharp decline, continuing steadily downward until the 2018–2019 season. Excluding the 2012–2013, 2019–2020, and 2020–2021 seasons—marked in red due to reduced games caused by lockouts and the COVID-19 pandemic—it is clear that power play opportunities have generally declined since 2005.
Conclusion
The Dead Puck Era (1997-2004) represents a defining chapter in the NHL's history, marked by a decline in scoring that prompted significant changes in how the game was played and regulated. The defensive systems of the time and lenient enforcement of obstruction penalties further limited scoring opportunities. The increasing size of goaltending equipment also played a key role in tipping the balance in favor of defensive play. This era emphasized the delicate balance the NHL must uphold between offense and defense to sustain the game's excitement and appeal. Scoring is the cornerstone of hockey, driving its thrill and entertainment, and the league must ensure a consistently high level of scoring to keep fans engaged and invested in the sport.